Once an Arduino measurement system is reporting measurements such as distance described in the previous post, it's nice to add the capability to turn the data reporting on and off. This is because the Arduino continuously loops, making it difficult to extract "real" data from the stream of values being reported. One could add a delay to slow the reporting, but this will affect measurements like motion by limiting the range precision of position measurements and thus reducing the range of velocities that are measureable.
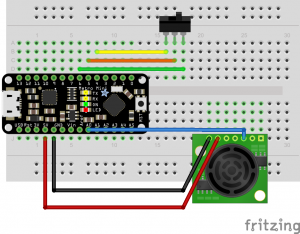
Let's look at having the Arduino report measurements only when a switch is "on". This is going to require us to understand the idea of digital input and output (I/O), which is different than the analog input we measure with the ultrasonic sensor.
 //This program will set digital pins 4 and 6 to HIGH and LOW.
 //It will also read the digital pin 5.
void setup() {
  // put your setup code here, to run once:
  Serial.begin(9600); //open communication b/w the Arduino and computer
  pinMode(4, OUTPUT);//set digital pin 4 as output
  pinMode(5, INPUT);//set digital pin 5 as input
  pinMode(6, OUTPUT);//set digital pin 6 as output
}

void loop() {
  // put your main code here, to run repeatedly:
  digitalWrite(4, HIGH);
  digitalWrite(6, LOW);
  if(digitalRead(5) == HIGH){
    //check to see if the switch is "on"
    Serial.println("report data");//if "on" send to the serial port
  }
  else{
    //if the switch is "off"
    //do nothing and move on
  }
  delay(200);
}
Recompile and upload your code to check the functioning of your code. If it appears to work, test it in various conditions. For example, try to measure an object such as a ball rolling across the table. Use tape on the table to turn the switch on and off to capture the motion only while the ball is moving between the initial and final tape points.
Let's look at constant velocity motion with our sensors.
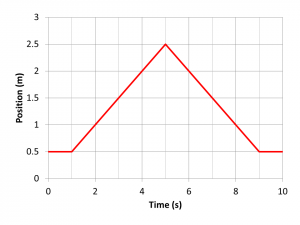
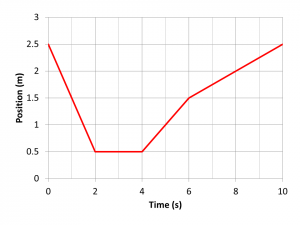
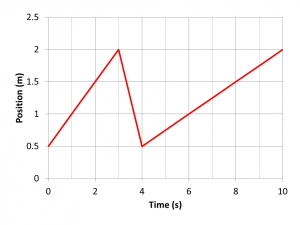
- Look at the following graphs. You will be given printed copies of them. Label on the graphs each section corresponding to motion that is different from the section before and after. In the label, include the \(\Delta x, \Delta t\), and average velocity, \(\langle v\rangle\). Also, write one sentence explaining what happens in that section of motion, e.g., “The object undergoes a displacement in the positive direction of 2 meters over 1 second, giving a velocity of 2 m/s in the positive direction.”
- Use your motion sensor and Arduino to create duplicate graphs like these by moving in front of the sensor with a small whiteboard. You should be careful to produce the graphs as accurately as possible including the particular distances and times. Putting tape on the floor may help. Practice with the Serial Plotter, then use the Serial Monitor to collect data that you copy and paste into Excel. For the time variable, assume each data point corresponds to the delay of 100 ms. This is not quite right since the Arduino takes time to loop, but it is off by less than 1 ms.
- In Excel make graphs of your motion to include in a lab report.
- Expectations: The velocities are to be calculated correctly. Experimentally, the average velocity within each time segment of your LoggerPro graph should be within 1 m/s of the calculated value. Be sure to calculate these for each segment. Also the starting/ending times of each time segment of your LoggerPro graph should be within 1 second of those given in the position vs time graphs.
- The three questions from last week.
- Do the answers to these questions affect the precision of today's measurements?
- The labeled handout graphs. Take a picture of them with a webcam or phone.
- Your Excel graphs and calculations of average velocity for each segment. Be clear about how you calculate average velocities by including \(x_i, x_f, t_i, t_f\).
- Describe the motion sensor's coordinate system. How does it define positive and negative?
Lab Report
Write a summary report in Microsoft Word. You will save it to the shared OneDrive that I sent a link. Makes sure the relevant Excel work is in the Word document. I do not want your Excel document. In your lab report include:


No comments:
Post a Comment