Let's look at some more complex motion with our motion sensor. We will measure the motion of a cart driven by a fan. The arrangement is shown below.

Serial.print(millis()*1000);
Serial.print(",");
Serial.println(distance);
In this example, the first line of code prints the time in milliseconds multiplied by 1000 to convert to seconds. This line will not put a carriage return since it has
printlnThe second line prints a comma, and the third line prints the distance with a carriage return. The distance should be your calibrated distance from previous lab work. The third line will insert a carriage return so that the next values that go to the serial port are on a new line.
Now we are ready to measure the motion. Place the cart on the track so that it moves away from the motion sensor. Using the switch on the Arduino, start the cart moving by turning on the fan and measure the motion of the cart while it is moving freely between the track ends. Be sure the Serial Monitor is open so you can copy the time and position data after the measurement ends.
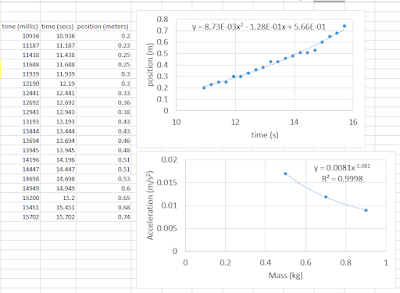
Copy and paste the data into Microsoft Excel. Make a graph of the data (be sure to label the graph axes). Add a polynomial trendline to the graph, and use it to determine the initial position, initial velocity, and acceleration. Recall \( x_f = x_i +v_i t + \frac{1}{2}at^2 \)is related to the trendline \( y=c+bx+ax^2 \)
Have the cart move toward the motion sensor to determine whether the acceleration is the same magnitude but opposite direction. If you feel like the measurement of acceleration is reproducible, try adding mass to the cart and measuring the acceleration again. Repeat this for one more addition of mass. Be sure to keep the mass in the middle of the cart so that it doesn't have more mass on one side of it.
When you have three masses measured, make a graph in Excel of acceleration (y-axis) vs. mass (x-axis). How do the two values appear to be related (linear, quadratic, hyperbolic)? Try adding a "power law" trendline to determine the dependence. Sir Isaac Newton said that force is mass times acceleration. \( F=ma \). Assuming the fan exerts a constant force because it always blows air in the same way, we can assume the force is some constant number. Rearranging the equation \( a=F/m \). Does this agree with your graph trendline? Explain. What is the force the fan exerts?

No comments:
Post a Comment