This is a big one! The Arduino is going to do some heavy lifting for us. We are going to program a pressure, temperature, and altitude sensor (all-in-one). We'll check that it works. Then, we'll program an SD card adapter and make sure we can send data to a file on the SD card. Finally, we'll put the two together and power the Arduino with a battery so we can do some portable data collection.
The PTH (pressure, temperature, height) sensor is the Adafruit BMP180. It is shown below. It communicates through a protocol called I2C (Inter-Integrated Circuit). While it is good to understand these protocols, we can get away with knowing almost nothing since libraries have already been written to work with this sensor. To begin, in Arduino open from the sketchbook a program called BMP085 (see below). We'll go over the code together in lab and see that we know how to identify key features for getting data from the sensor.
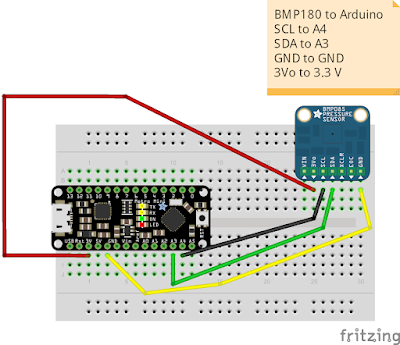
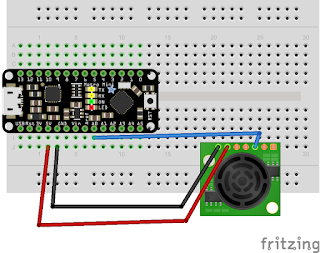
To wire the sensor, look at the diagram below. Make sure your Arduino is NOT connected to the computer while wiring the sensor. Let the TA or instructor verify your connections before connecting the Arduino to the computer through USB.
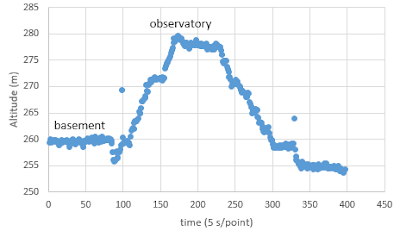
Upload the code to the Arduino and use the Serial Monitor to read the sensor output. Does it appear to work as you would expect? How might you test it for altitude? e.g., what is the altitude of Berea, KY above sea level? How might you test it for temperature? Try it.
Before we move on to the SD card, let's make sure we know how to create some data that looks like something we know. Open a new Arduino sketch and save it as SineWave-yourinitials. We'll write a program to create a sine function \(y=\sin\omega t\). First, we need to declare some variables to store the time and the y value. Note that in Arduino, "time" is a protected keyword, and we cannot use it to store the time. Both of these values need to be decimal numbers. In Arduino, this is declared as "float".
float ts=0, yt;
void setup(){
...
}
We want to start the time at zero seconds. So it is initialized above. I call it "ts" for time in seconds. I call the function value "yt" for y as a function of t. Notice this declaration is before the setup, making these variables global to the entire program. In the loop we want to get the value of time using the millis() function. Convert this to seconds by dividing it by 1000.0. Once we have the time we can calculate the sine value. In Arduino "sin" is a known function and expects radians in its argument.
yt = sin(6.28*ts);
Finally, we need to write these values to the serial port. This requires beginning serial communication in the setup.
Serial.begin(9600);
Then, it requires writing the values to the serial port in the loop after they have been calculated.
Serial.print(ts);
Serial.print(", ");
Serial.println(yt);
Test that this works by uploading it to the Arduino and seeing what happens in the Serial Monitor. Copy and past some of the data into Excel and make a graph of it. Does it look like you expect?
Now that the sensor is working and we know how to create known data, let's try to save information to an SD card. We are going to use the Catalex MicroSD Card Adapter. An pin diagram is shown below.
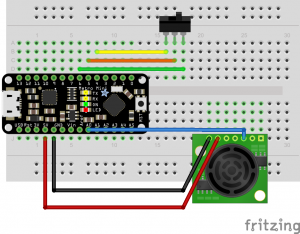
This device communicates through what is called SPI (Serial Peripheral Interface). Similarly, we don't have to know exactly how this works at this point as long as we can use existing libraries. Wire the adapter as described. NOTE: The pins on your adapter are not in the same order as the image shown below. Read the connection table in the figure below. Disconnect your Arduino before making connections. Let a TA or instructor see your connections before powering the Arduino with the USB cable.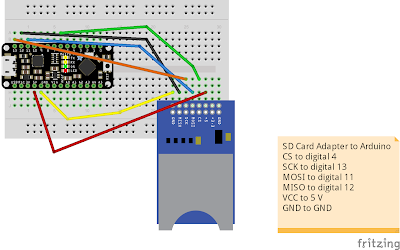
In the Arduino software, open the sketch SD_card_write (see below). We will discuss features of the program together in lab. Afterward, see if you can create a way to store the values of \(\sin \omega t\) where \(\omega = 2\pi\) and time is calculated using the Arduino function "millis()". Store the value in decimal variable (float) and write the time and sine wave values to a file on the SD card. Make the filename "sinewavedata.txt". Remove the SD card and use Excel to plot the data in the file.

